Server Operations & Monitoring
Server Admins use Server Administration to watch host health, inspect server logs, review task usage, clean up Docker resources, and manage server updates.
Open it from the admin menu by choosing Server Administration. The page has three tabs:
- Health - Infrastructure metrics, update controls, and Docker cleanup actions
- Logs - Server output with filtering, search, time-range queries over persisted history, selection, copy, and live tailing
- Usage - Task volume, success rate, code impact, duration, and drilldowns
Only the basic /health endpoint is public, for uptime checks. Detailed health metrics and drilldowns, logs, usage statistics, cleanup operations, update installs, and restart actions require Server Admin access.
Health Dashboard
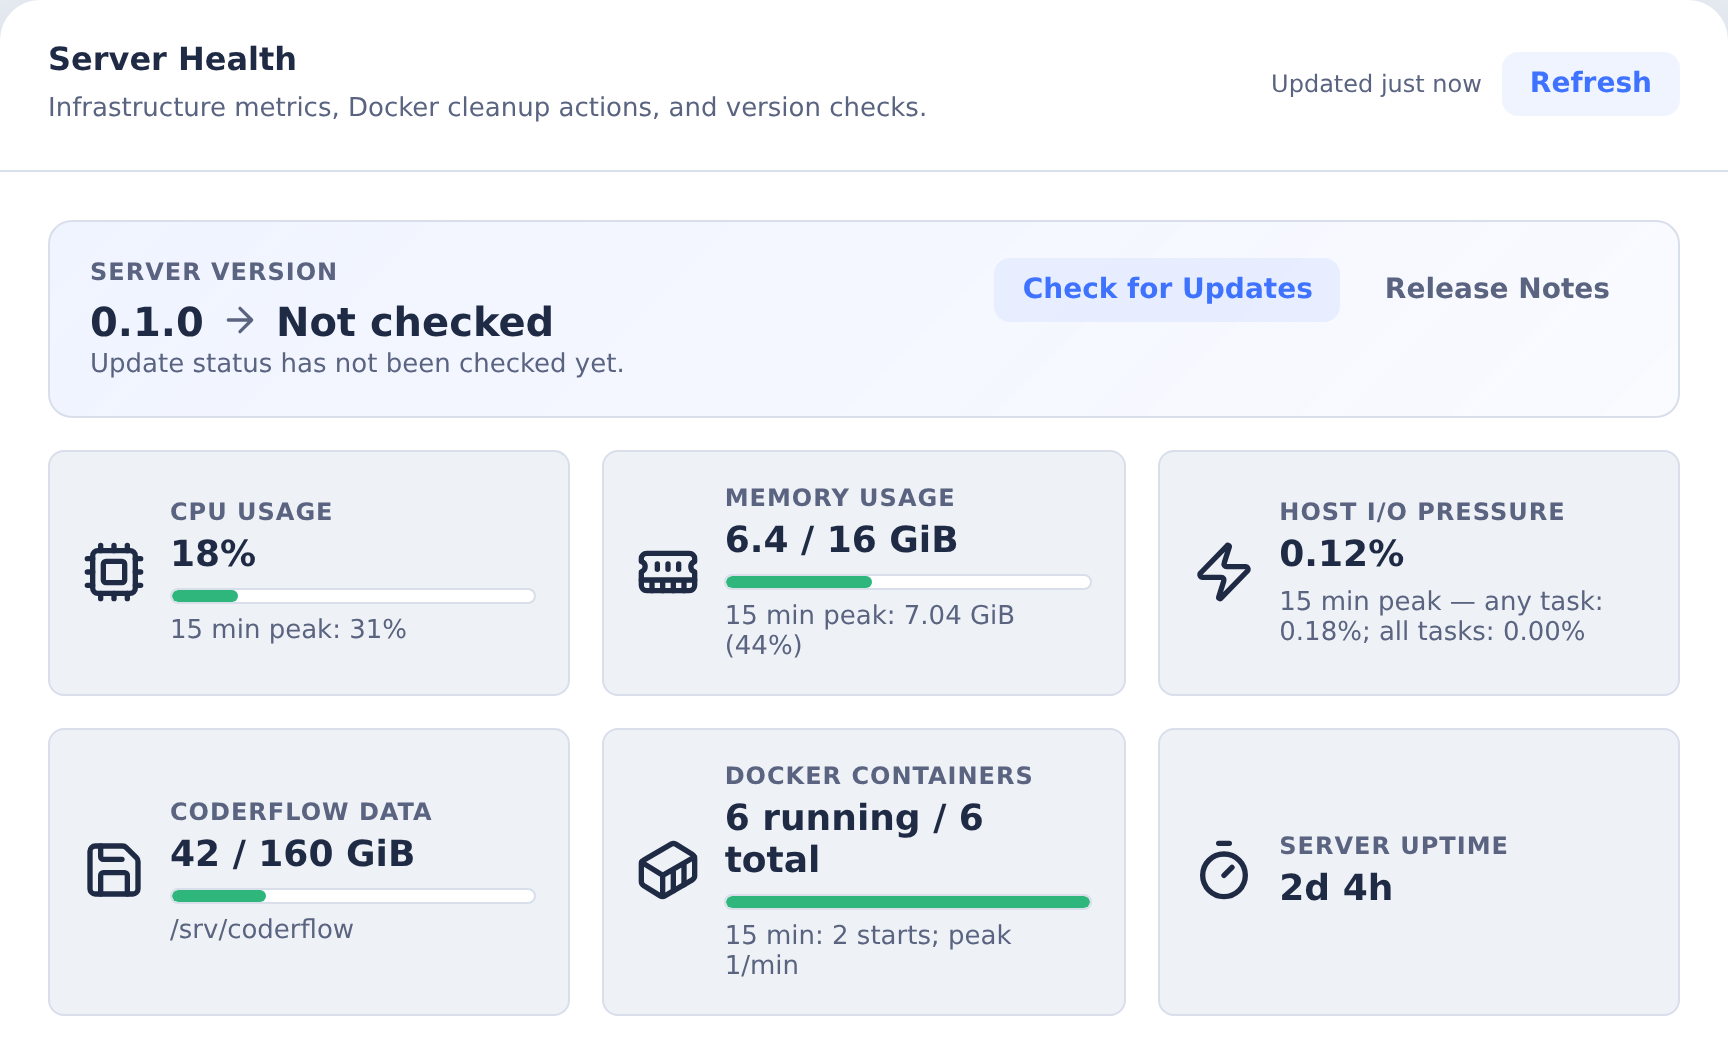
The Health tab shows the current state of the CoderFlow host and its Docker runtime.
Metrics are read when you open the tab and whenever you click Refresh; they do not poll in the background. Collecting them queries the Docker daemon, which can take several seconds on a host with a large image or build cache, so the reload runs on demand rather than on a timer.
Next to Refresh, the header reports how old the figures are - Updated just now, Updated 45s ago, Updated 12m ago. It turns amber once the reading is more than five minutes old, and reads Refreshing... while a reload is in progress. The values already on screen stay visible during a reload.
The top-level cards include:
- CPU Usage - System CPU utilization since the previous measurement
- Memory Usage - Used memory, total memory, and percentage used
- CoderFlow Data - Usage of the filesystem holding the CoderFlow data directory, with the path shown on the card
- Docker Containers - Running containers compared with total containers
- Docker Storage - Docker object storage with images, containers, volumes, and build cache broken out separately
- Server Uptime - Current CoderFlow server process uptime
- Active Users - Count of users who currently have CoderFlow open in a browser
Status bars turn warning or critical as usage climbs.
CoderFlow Data describes where CoderFlow writes its own data - task storage, uploads, and session files - which is not necessarily the root filesystem, and is not where Docker keeps its images. Docker's own capacity is reported separately on the Docker Storage card.
Metric Drilldowns
Click a metric card to open its details modal.
System Information
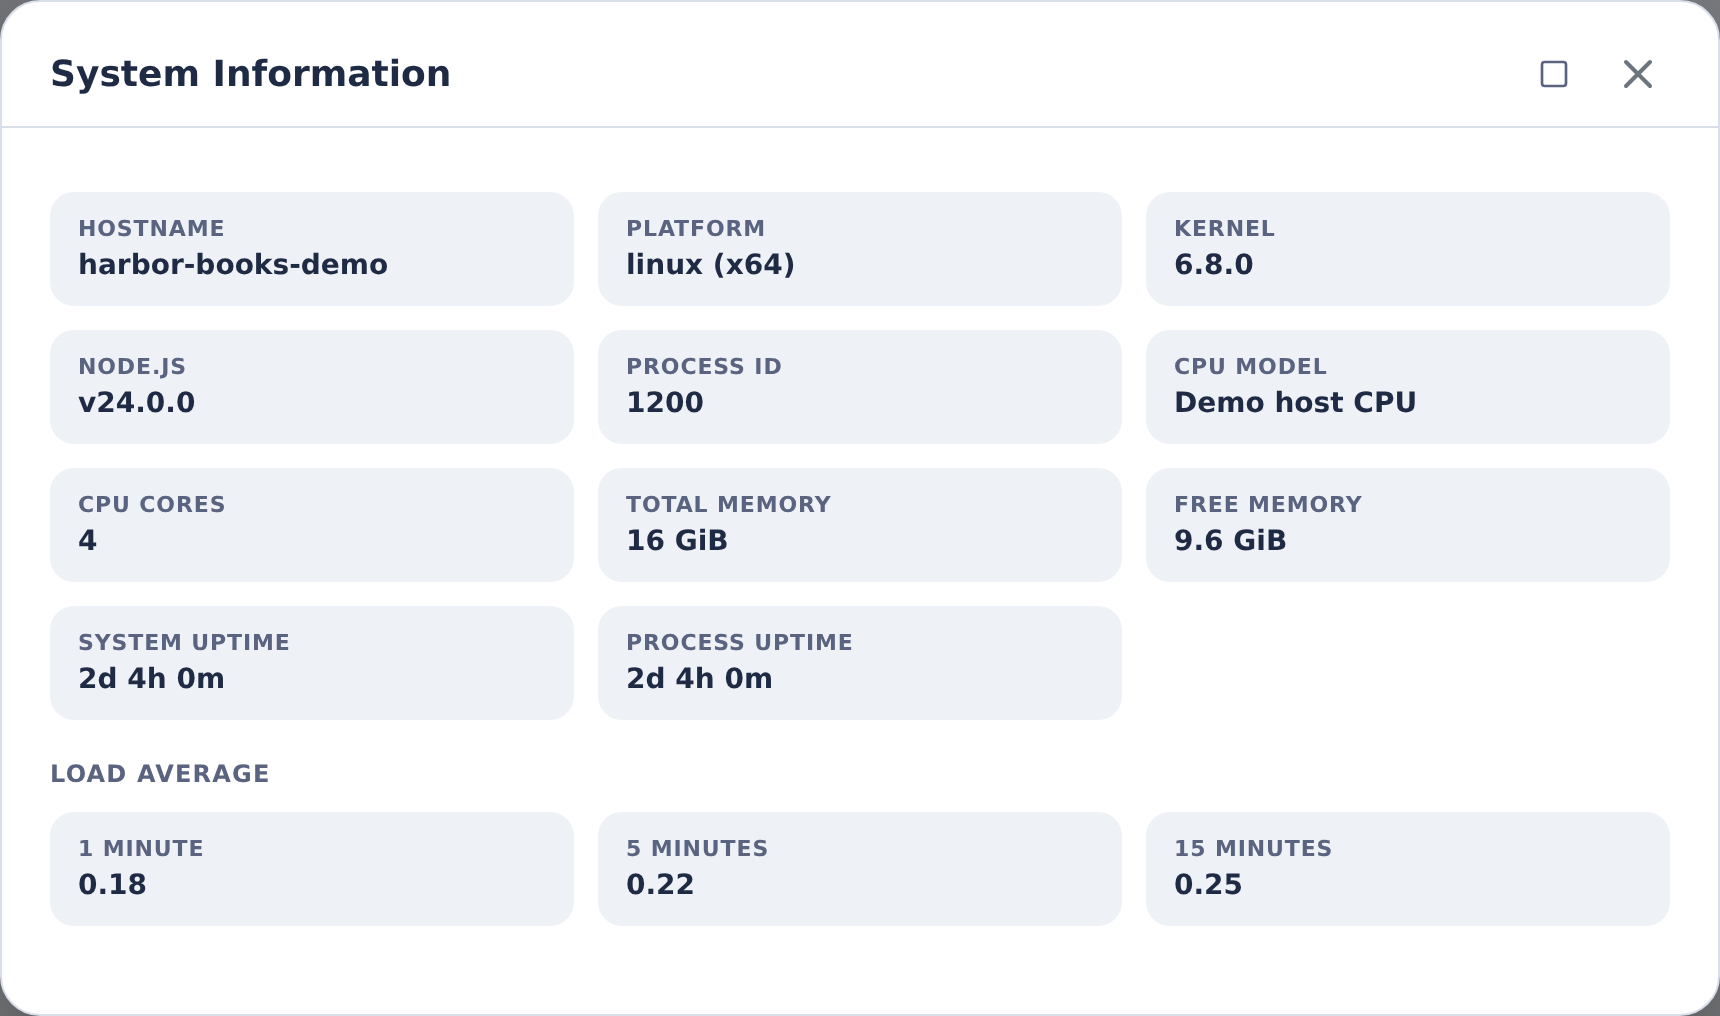
The CPU, memory, disk, and uptime cards open System Information. Use this when you need host facts while debugging a server issue:
- Hostname, platform, architecture, and kernel release
- Node.js version and server process ID
- CPU model, core count, and per-core speed when the core list is small enough to display
- Total and free memory
- System uptime, process uptime, and load averages
Docker Containers
The Docker Containers card opens a container table with name, image, status, task, user, exposed ports, created time, and per-container actions.
Every column header is sortable - click it to sort, click again to reverse.
The Task column names the task a container belongs to and links to its task page. When the container still carries a task ID but the task record itself is gone, the column shows the bare ID instead, since there is no task page left to open. Containers that are not task containers at all, such as interactive sessions, show a dash.
The User column names who the container was built for. This is normally the person who launched it, which is not always the person who owns the work - launching someone else's objective attributes the container to the launcher. A follow-up submitted after the container was created re-attributes it to whoever sent the follow-up.
Two cases resolve differently:
- No user recorded on the container, as with automation launches, falls back to the creator stored on the task.
- A recorded user who has since been deleted shows the raw user ID, unless the task's stored creator is that same user, in which case their details are used. The table deliberately does not substitute a different person's name.
Use the modal actions when a specific container is clearly stale:
- Stop - Stop a running container while leaving it on disk
- Remove - Stop if needed, then remove the container
Removing a container does not delete the task record, logs, or generated output, but it does remove the interactive container environment for that task.
Docker Storage
The Docker Storage card summarizes:
- Images
- Containers
- Volumes
- Build cache
- Total estimated size
- Estimated reclaimable space
- Capacity and free space for each filesystem holding Docker's data
Docker's image layers and its volumes can live on different filesystems. When they do, the card shows a row and a usage bar for each, and the card's overall status reflects whichever is under the most pressure. When both sit on the same filesystem, the rows collapse into one.
The measurement refreshes in the background every 10 minutes, so the reading can be a few minutes old; the card notes the age once it exceeds 15 minutes. If capacity cannot be measured - most often on a new server whose base image has not been built yet - the card reports the object sizes without a usage bar rather than showing a figure it cannot substantiate.
Docker's own size categories overlap, so the individual rows can add up to more than the reported total.
The build cache overlaps with image layers, because BuildKit stores both in one place; the build cache row names how much of it is shared.
On hosts using the containerd image store, the overlap is larger still: image layers, container layers, and build cache all live in one store, and Docker reports the size of that whole store under its images heading. On those hosts the card groups the three beneath a Layer store row, so it is clear they are parts of one store rather than separate totals that add up.
The images figure listed there is the space unique to each image. Layers that images share cannot be attributed to any one of them from what Docker reports, so they appear only in the store total.
The storage drilldown lists Docker images and volumes. Use it to identify large images, old image tags, and unused volumes before running broader cleanup.
Active Users
The Active Users card counts the people who currently have CoderFlow open in a browser, not the number of stored logins. Every CoderFlow page checks in with the server about once a minute, and a page reports itself as closed when you navigate away or close the tab, so someone who signed in yesterday and closed their browser is not counted. Several tabs or windows belonging to the same person count as one user, and CLI or API traffic is never counted.
The drilldown lists each active user with their username, name, when their current stretch of browser activity began, and how long ago their browser last checked in. A user drops off the list once their browser has been silent for three minutes, which covers cases like a closed laptop or a dropped network connection where the browser never got the chance to report itself as closed.
Use it to check whether operators are currently connected before restarting the server or stopping containers.
Server Updates
The Health tab also shows Server Version.
Click Check for Updates to compare the running server version with the latest published @profoundlogic/coderflow-server package. When a newer version exists, the page shows the latest version and an install command you can copy.
Web-managed update actions are controlled from Server Settings -> Update Management:
- Enable Web Updates - Allows Server Admins to run updates and restarts from Server Administration
- Allow local package installation - Off by default. Requires Enable Web Updates and permits Server Admins to upload and install a trusted server
.tgz. It is independent of npm updates. - Update Command - Command used to install a selected version. Use
{version}as the placeholder for the version chosen from the Health tab. - Restart Command - Optional command used to restart the server after an update
When web updates are enabled and an update is available, Update Server runs the configured update command and shows command output in the page. Restart Server opens a confirmation dialog and then waits for the server to come back online.
Install a downloaded server package
Use Install from file… to install a trusted @profoundlogic/coderflow-server
.tgz downloaded from a deployment task. This bypasses waiting for the server
package to appear on npm, but dependencies may still require network access.
- In Server Settings → Update Management, enable Enable Web Updates and
Allow local package installation, then save. Return to Administration →
Health and choose Install from file…. Select the server
.tgz(up to 256 MiB) and click Upload and inspect. Inspection does not execute or install package contents. CLI, unrelated, and malformed archives are rejected. - Compare Running build and Uploaded package: package identity, version, commit, build time, and package SHA-256. Compare the checksum with the deployment checksum attachment. Older artifacts need no new sidecar file; missing optional commit/build details are shown as “not included.”
- Click Install inspected package. Confirm a downgrade or same-version reinstall when prompted. Different or older artifacts can share a version; same-version packages are not silently blocked. Upload progress, installation status, and the completed command's output/errors appear on the page.
- After installation succeeds, choose Restart Server separately. Keep this page open: it retains the expected build while reconnecting. It verifies a new process, the version, and available build details, rather than assuming that an HTTP connection means the correct package is running. A mismatch remains visible and can be checked again with Retry Connection.
Only Server Admins can inspect, install, or restart. Enable Web Updates
is required for all these actions; Allow local package installation is also
required for file operations. Turning off local installation immediately blocks
installation of packages already inspected. In setup.json, this opt-in is
update_management.allow_local_packages and defaults to false.
Deployment and artifact-download permissions do not grant installation authority.
Hosting providers that manage updates externally disable these actions.
File installation supports the default global npm Update Command and its older
default form. It preserves global installation and the required native dependency
script flags. Custom Update Commands are unsupported for file installation:
{version} only selects an npm version. Use the operator's installation procedure
for custom destinations or commands; the file action will not bypass them.
Inspection expires after 30 minutes. Upload again if it expires, the server restarts, another upload replaces it, or an install fails. The staged upload is removed after installation or when you close it. Concurrent updates are rejected. Support logs record the administrator, checksum, version/build, and install result. Installation can modify installed files and dependencies; it is not an atomic replacement and provides no automatic rollback.
After restart, current builds compare a startup fingerprint of all regular files
in the server package, including modules, UI, assets, and manifests. The top-level
node_modules dependency tree is excluded because npm installs it separately.
Older server builds use reset uptime and reported version/build metadata; the
success message explicitly says that package files could not be verified. Missing
or mismatching evidence remains visible and may require manual checking. Source
checkouts cannot provide the installed-package fingerprint. Connectivity alone
does not prove that the expected build is running.
Install only artifacts from trusted deployment outputs. Package names and build metadata can be forged. Inspection and SHA-256 do not authenticate a publisher or scan for malware; compare the checksum with a separately trusted deployment record. No signing policy is enforced. The installed code runs with the server account's privileges, and health verification is not remote attestation of a malicious server.
Browser-session update operations and Update Management settings changes use session-bound CSRF protection automatically. API-key access retains its existing permissions; deployment/download access still cannot install code.
If Restart Command is empty, the web restart action sends SIGTERM to the server process. Run CoderFlow under a process manager, such as the built-in daemon mode, systemd, or PM2, so the process starts again after that signal.
Server Logs
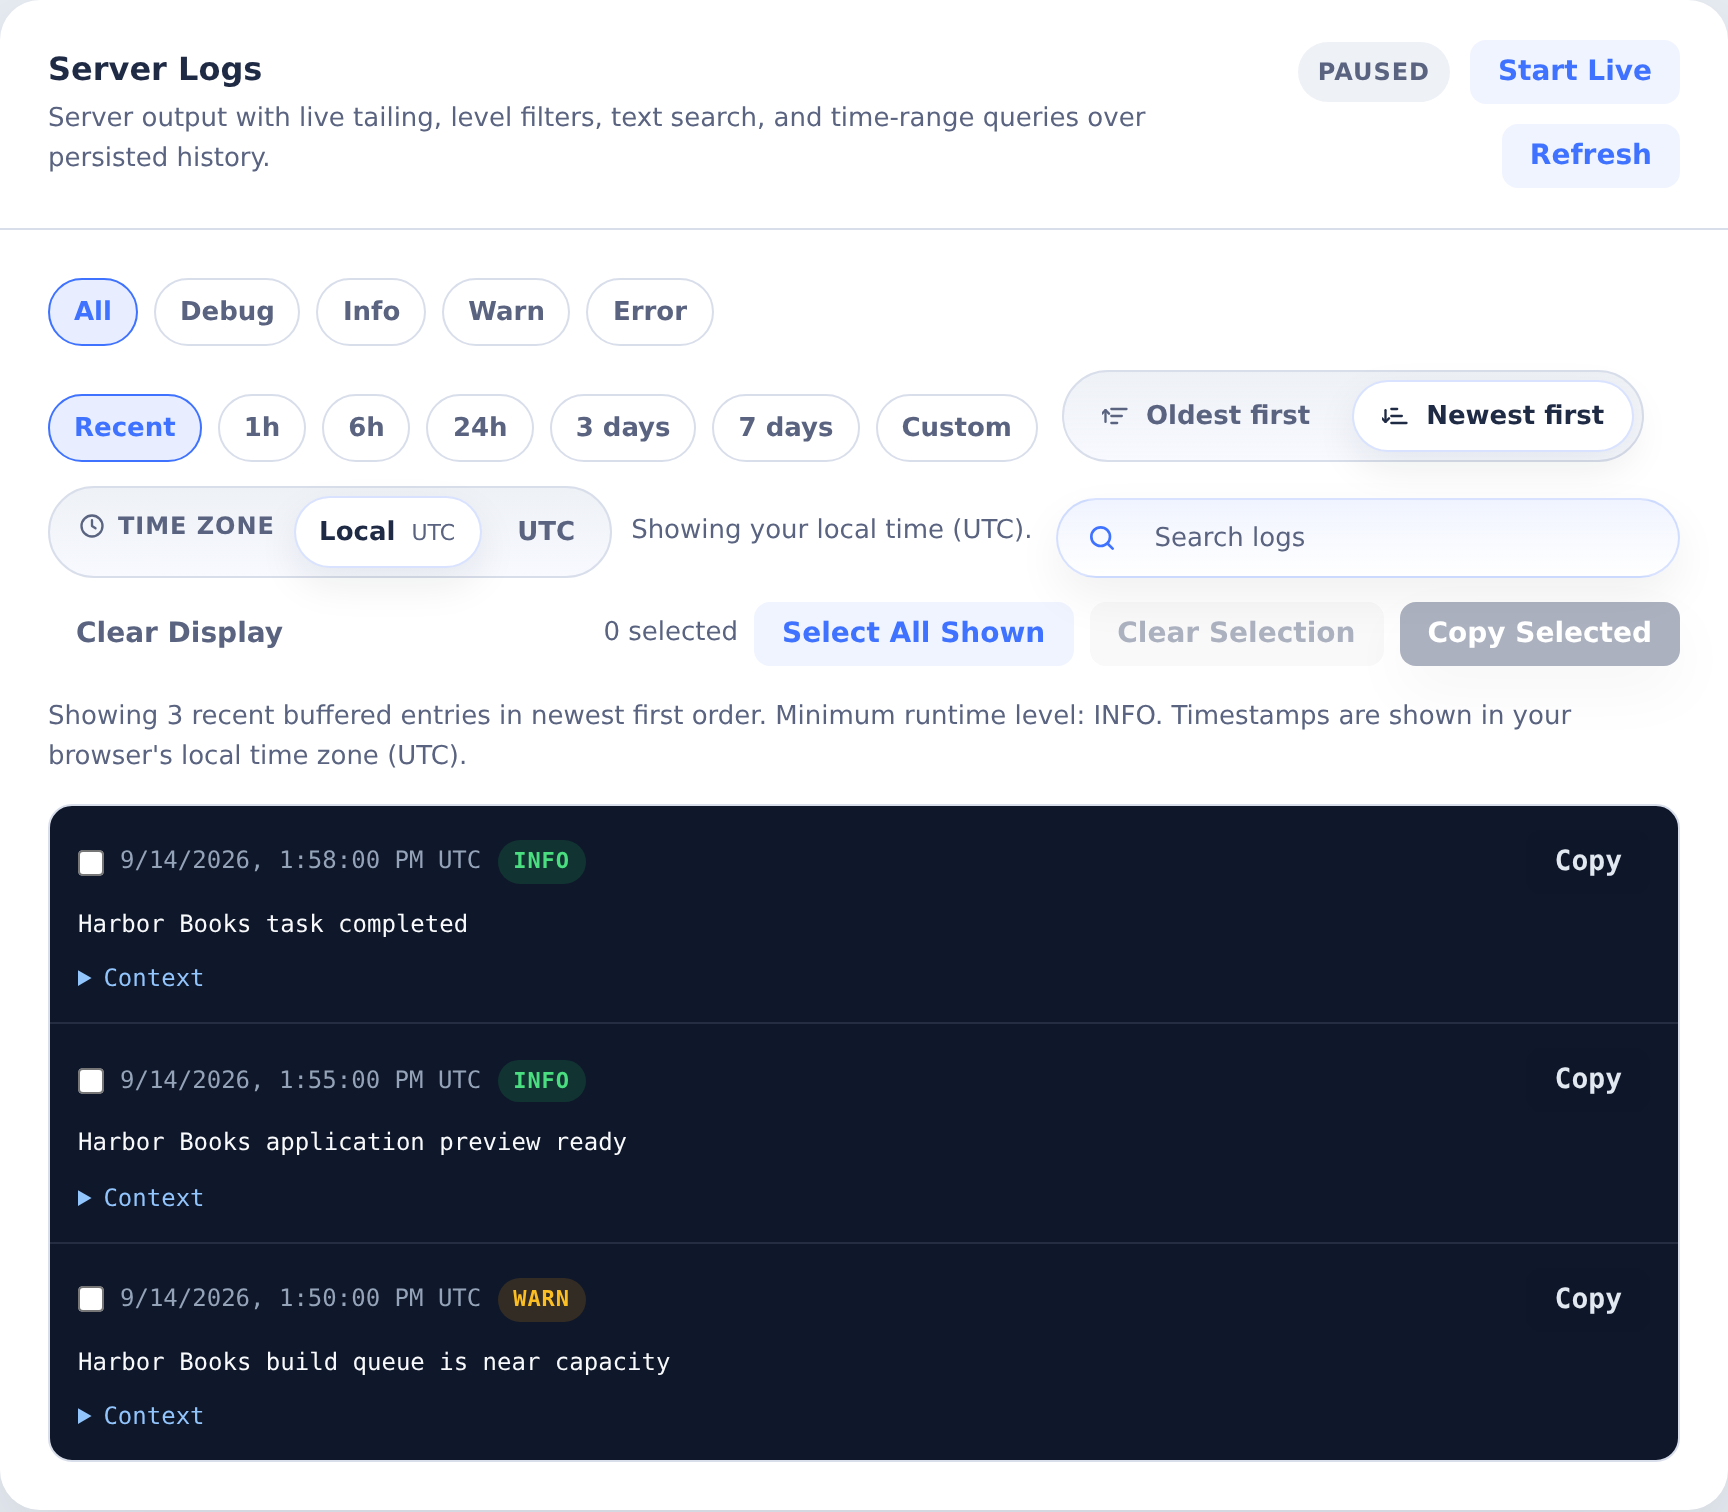
The Logs tab reads server output from two places. Recent entries come from an in-memory buffer, which holds 5,000 entries by default. Older entries come from persisted log history, which CoderFlow writes to daily files under server-logs/ in the server data directory and keeps for 14 days by default. Because the history is on disk, log queries reach back well beyond the buffer and survive a server restart. The UI loads entries for the active query and keeps up to 1,000 entries visible while live output is appended.
Retention is set with the SERVER_LOG_RETENTION_DAYS environment variable, and persistence can be turned off entirely - see Server Log Retention.
Use the toolbar to narrow what you are inspecting:
- All / Debug / Info / Warn / Error - Filter by severity
- Oldest first / Newest first - Change display order
- Search logs - Debounced text search across the message and structured context
- Start Live - Open a live stream of new log entries
- Refresh - Reload the current query
- Clear Display - Clear only the entries currently shown in your browser
Log Time Ranges
The range buttons choose how far back a query reaches:
- Recent - The tail of the in-memory buffer, which is the default view
- 1h, 6h, 24h, 3 days, 7 days - A window ending now
- Custom - A From and To pair of date-and-time fields, applied with Apply Range
For a custom range, leave From empty to search from the start of retained history, or leave To empty to search up to now.
Below the toolbar, the meta line reports what you are looking at: how many entries matched, the window they cover, whether they came from the memory buffer or persisted history, the sort order, and how long history is retained.
Any range other than Recent is a historical query, which does not mix with live tailing:
- Choosing a historical range while live tailing is on stops the stream.
- Choosing Start Live while a historical range is selected switches back to Recent.
A range that reaches further back than the buffer holds is served from persisted history automatically. If persistence is disabled, queries are limited to what the buffer still holds.
Inspecting and Copying Entries
Log entries can include structured context. Expand Context on an entry to inspect it.
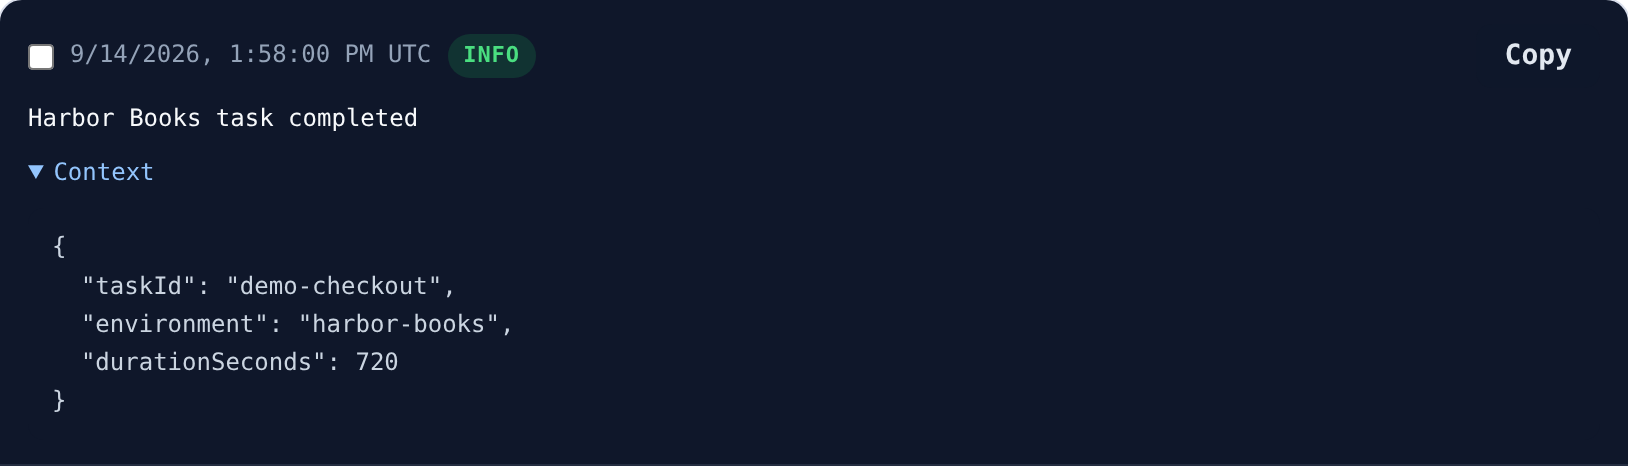
For incident notes or support handoff:
- Filter or search until the relevant entries are visible.
- Use the checkbox on each entry, or Select All Shown.
- Click Copy Selected.
The copy action includes timestamp, severity, message, and context. Clear Display affects only your browser - it does not clear the server-side buffer or the persisted log history.
Usage Statistics
The Usage tab summarizes task activity across loaded task history.
Start by choosing a period:
- 1 day - A rolling 24-hour window, shown as "Last 24 hours" in the period summary
- 7 days
- 30 days (the default)
- 90 days
- All time
Then optionally choose an Environment. The period and environment filters apply to every summary, table, chart, and drilldown on the page.
The summary cards show:
- Total Tasks - All non-objective tasks in the selected scope
- Success Rate - Completed tasks divided by completed, failed, and interrupted tasks
- Net Lines - Lines added minus lines deleted
- Duration - Average completed-task duration, with median and total duration in the detail text
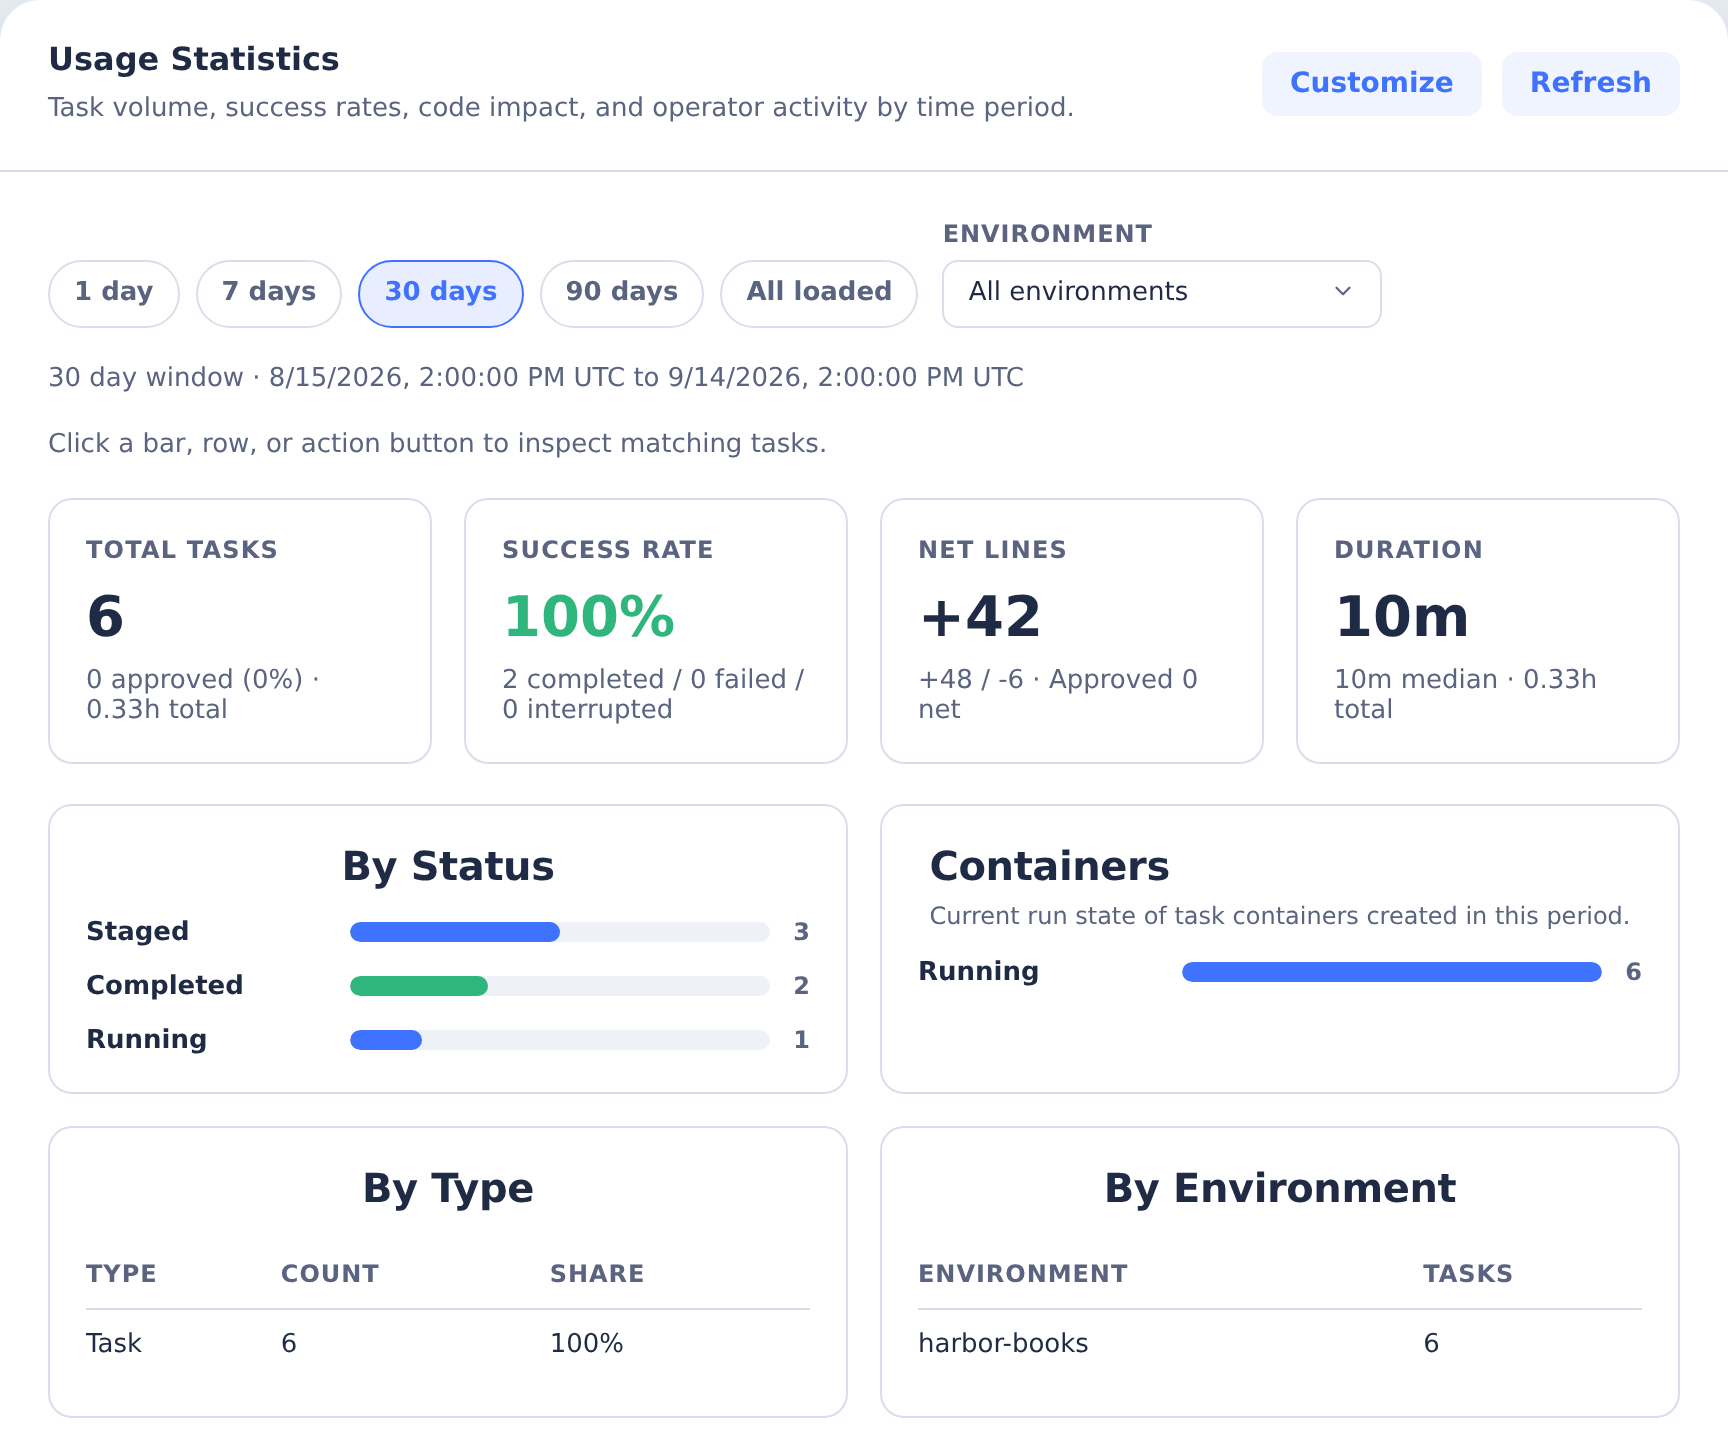
The breakdown sections show:
- By Status
- Containers - The current run state of the task containers created in this period: running, stopped, paused, removed, or unknown. Removed means the Docker daemon no longer knows the container; unknown covers containers whose state has not been determined yet. Tasks that never had a container are not counted.
- By Type
- By Environment
- By User
- By Source
- Code Impact
Note that Containers reports state as it is now, while every other breakdown describes the tasks created during the period. A 90-day view will show most containers as removed simply because they have since been cleaned up.
Click a status bar, table row, or code-impact action to open the usage drilldown drawer. The drawer lists matching tasks newest first and includes environment, user, source, type, created time, duration, finished time, approval state, pushed state, file count, repository count, container state, and code impact.
Use drilldowns when you need to answer questions like:
- Which failed tasks happened in the last 7 days?
- Which environment is creating the most task volume?
- Which approved tasks changed code but have not been pushed?
- Which tasks came from automations or integrations instead of manual creation?
Customizing the Dashboard
Use Customize to choose which breakdown sections appear. Toggle any card off to hide it and on to bring it back. Your choice is stored in your browser, so it applies to you rather than to everyone on the server.
At least one card always stays visible - the last remaining card cannot be hidden.
Cleanup Operations
The Clean Up section is collapsed by default on the Health tab. Expand it when host resources need immediate attention.
Stop All Containers
Use Stop All Containers when the host is under pressure or you need to stop every running container before maintenance.
This gracefully stops every running container visible to the Docker daemon that CoderFlow is connected to, not only CoderFlow task containers. Use it carefully on shared Docker hosts. Active coding sessions, terminals, code-server windows, and app-server sessions will disconnect. Task records and output remain available.
Remove Stopped Containers
Use Remove Stopped Containers after review work is complete and stopped containers are no longer needed for interactive inspection.
This deletes all stopped containers, including those with container protection, which only applies to automatic removal. It frees disk space and preserves task history, logs, output, and saved diffs. The removed container cannot be restarted, but you can use Continue in New Container on the task page to fork the task and continue from its saved history. Unsaved state that existed only inside the container is not recoverable.
Docker System Prune
Use Docker System Prune when Docker object storage is growing and targeted cleanup is not enough.
The web action runs Docker prune operations for containers, images, networks, and volumes. It is broader than removing stopped containers and can remove unused Docker resources that are unrelated to a specific task.
When this manual prune removes a task container, its task history remains available and Continue in New Container can create a fork, just as after Remove Stopped Containers. Per-task container protection does not block manual prune.
The storage card still reports build-cache usage. If build cache remains high after a web prune, run your organization's standard Docker builder cleanup command on the host.
Automatic Cleanup
CoderFlow also reclaims Docker storage on its own when a measured filesystem comes under disk pressure. This is enabled by default.
Automatic cleanup removes dangling images, unused build cache, and unused networks. It runs at most once an hour.
It never removes tagged images, containers, or volumes:
- Tagged images include the CoderFlow base image and every environment image. Docker treats an image as unused whenever no container is running from it, which is the normal idle state of an environment - so removing unused images automatically would delete the images tasks are launched from.
- Volumes hold user data.
- Containers are reclaimed separately by the task-aware lifecycle sweep, based on finalization or stopped-container retention and subject to container protection - see Container Lifecycle.
Use the cleanup actions above for manual removal of these resources outside automatic storage prune.
A cleanup also runs immediately if a Docker operation fails because the disk is full, which reclaims space without waiting for the next check.
Configure it under Server Settings -> Docker Storage:
| Setting | Meaning |
|---|---|
| Enable Automatic Cleanup | Turn the behavior off entirely. |
| Trigger Level | How full Docker's filesystem must be. Warning is 75% full or under 20 GiB free; Critical is 90% full or under 10 GiB free. Both levels remove the same things; only the threshold differs. |
| Minimum Reclaimable | Skip cleanup unless at least this much can actually be freed, so a full disk with nothing to delete is not pruned repeatedly. |
While a cleanup is running, the Health tab shows its progress and disables the manual cleanup actions. The panel records when the last automatic cleanup ran and how much it freed.
HTTP Protocol Diagnostics
The default http_protocol mode is auto: complete TLS configuration enables built-in HTTP/2,
while a server without TLS continues to use HTTP/1.1. At startup, the server log records the
resolved protocol mode, advertised ALPN protocols, and whether WebSockets use HTTP/1.1 Upgrade.
coder-server status reports the resolved HTTP mode as well.
For a direct-TLS installation, verify the public health endpoint from another machine with a curl build that supports HTTP/2:
curl --http2 --silent --show-error --output /dev/null \
  --write-out 'HTTP %{http_version}, status %{http_code}\n' \
  https://coderflow.example.com/health
The expected result is HTTP 2, status 200. Browser developer tools should likewise show h2 for
the main document and ordinary resources. CoderFlow WebSockets continue to use separate HTTP/1.1
Upgrade connections, so seeing HTTP/1.1 for a terminal, code-server, or task-application socket is
normal.
HTTP/2 multiplexing prevents ordinary resources from waiting behind the browser's small HTTP/1.1 per-origin connection pool, including when several tabs hold live SSE task-update streams. It does not replace application-level connection cleanup: every SSE subscription and WebSocket still uses server resources until it disconnects, and a stalled downstream task application or integration can still leave a request open. Continue to monitor reconnect behavior and shutdown duration when investigating multi-tab or long-lived-connection issues.
If the endpoint unexpectedly uses HTTP/1.1, check the following:
coder-server config showreportshttp_protocol: autoorhttp_protocol: http2.- Both TLS paths are configured, readable, and contain matching PEM material.
- The startup log reports
HTTP/2 with HTTP/1.1 fallbackand ALPN protocolsh2andhttp/1.1. - You are testing the intended public endpoint. When a reverse proxy owns TLS, the public hop can use HTTP/2 while the private CoderFlow backend correctly remains HTTP/1.1.
See Installation for configuration, rollback, certificate, and browser-verification instructions.
Reverse Proxy Notes
When CoderFlow runs behind nginx, Apache, Cloudflare, or a load balancer, enable trusted proxy handling so the server reads forwarded HTTPS and client-IP headers correctly.
When the proxy owns the public TLS certificate, do not also enable CoderFlow's built-in TLS listener
on the private backend. The default auto protocol then resolves to HTTP/1.1, which preserves
ordinary proxy requests and WebSocket upgrades without adding a second TLS/protocol hop. You can
set http_protocol to http1 if you want to make that backend choice explicit.
You can enable it in either place:
- Set
TRUST_PROXY=truein the server launch environment. - Open Server Settings -> General Settings, enable Trust Proxy, save, and restart the server.
Trust proxy is important for HTTPS-aware OAuth callback URLs, generated absolute URLs, secure-cookie behavior, and accurate client IPs in audit logs. If you use the Web UI toggle, the value is stored in the server CLI config and takes effect after restart.
For initial server setup and process-manager examples, see Installation.
Operational Checklist
- Check Active Users before restarting the server or stopping all containers.
- Use Logs filters first, then copy selected entries for incident notes.
- Prefer Remove Stopped Containers before Docker System Prune when you only need to clear reviewed task containers.
- Run Docker System Prune manually when tagged images or volumes need reclaiming; automatic cleanup never removes them.
- Keep update management disabled unless the server's process manager and update command are tested.
- Enable Trust Proxy before configuring OAuth providers on a reverse-proxied HTTPS deployment.
- Confirm the startup HTTP mode and public ALPN negotiation after changing TLS or proxy settings.